Hazard coverage
Every hazard, resolved on real terrain.
PeriLens transforms climate projections into asset level risk intelligence by integrating high resolution hazard models, terrain analytics, Earth observation imagery, and exposure datasets. The platform quantifies flood depth, wind intensity, heat stress, wildfire exposure, and other climate hazards for every asset, delivering actionable insights for engineering, finance, insurance, and resilience planning.
Acute · hydrological
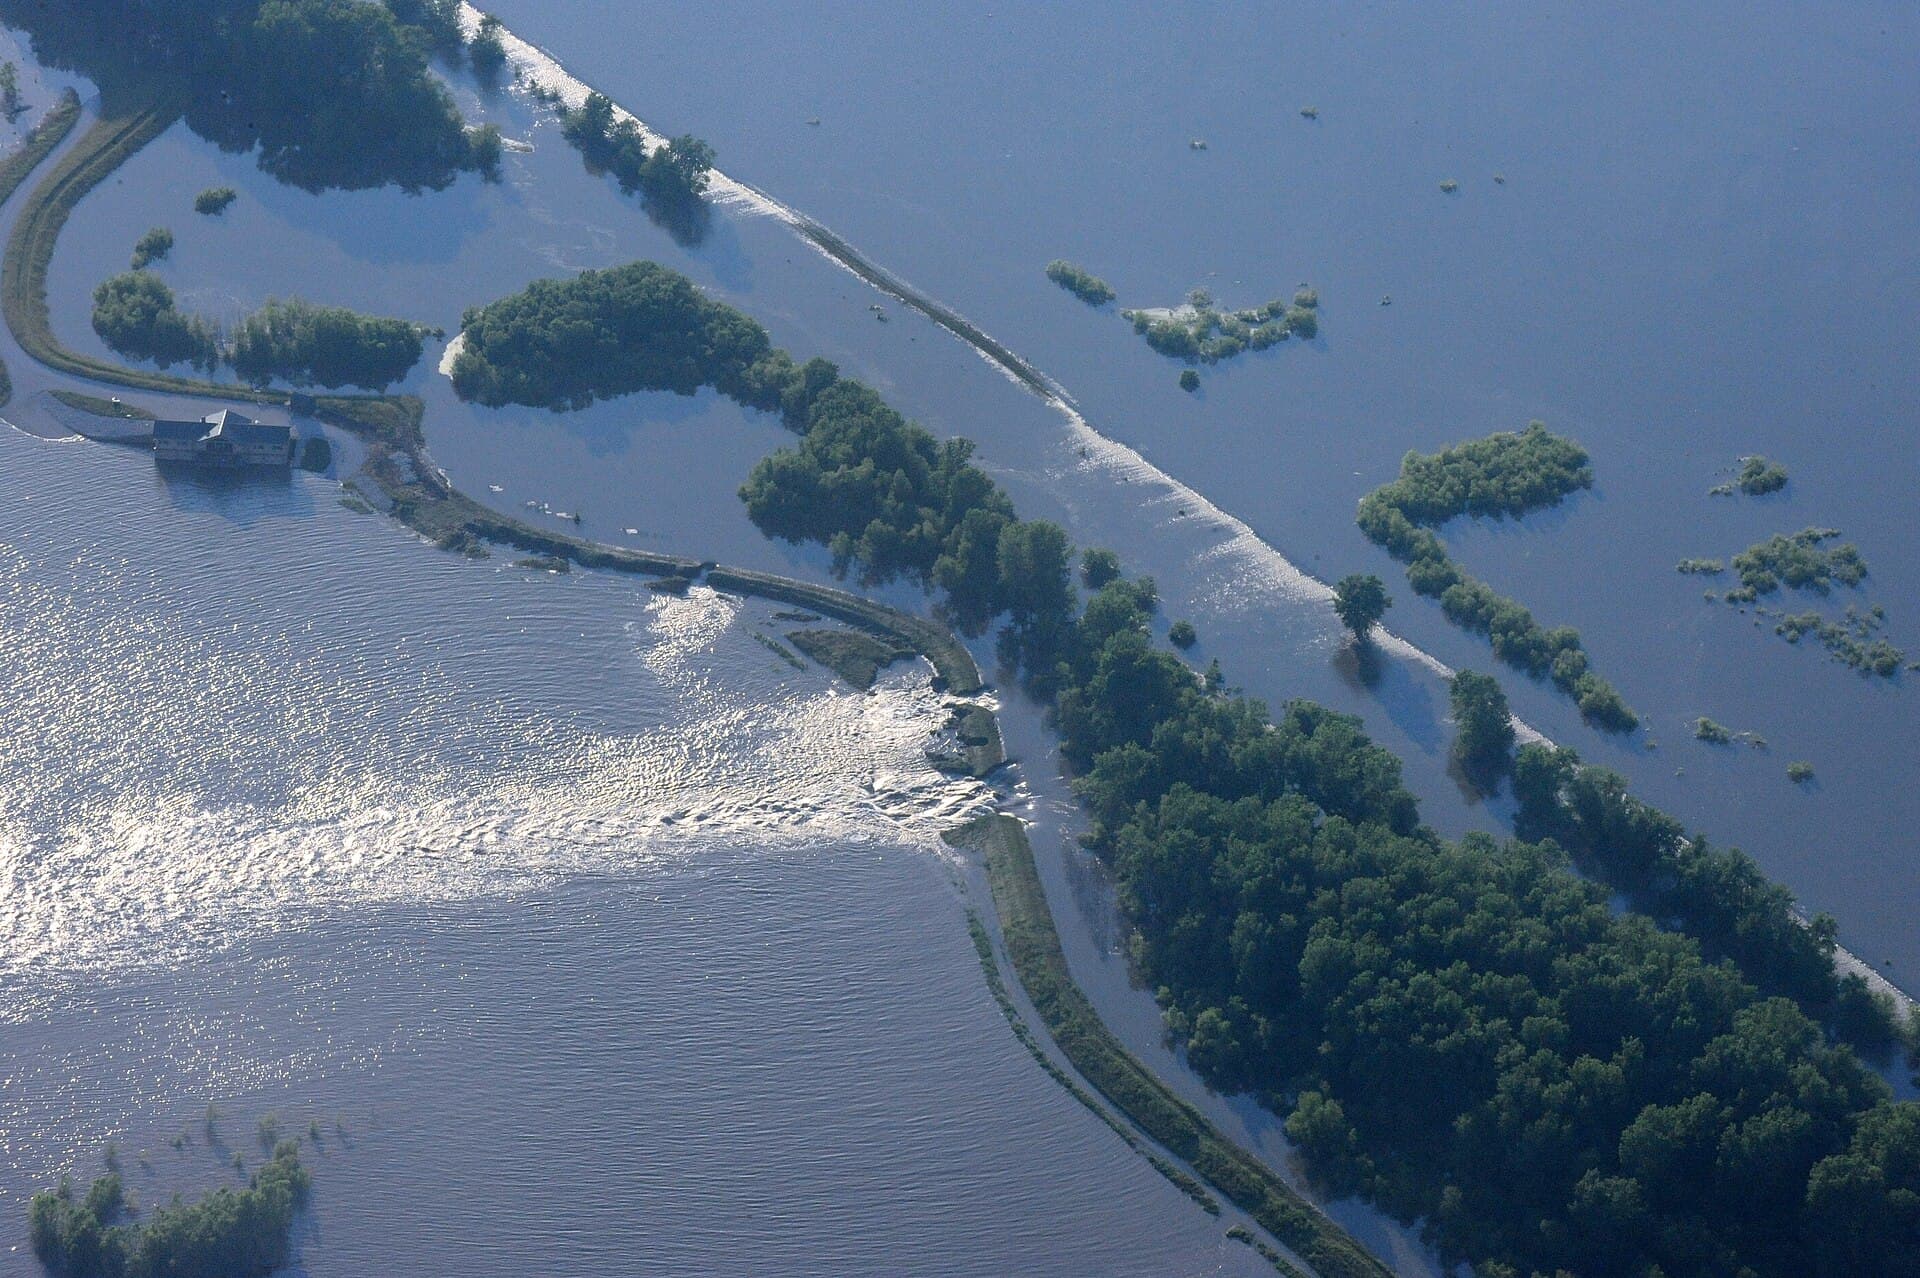
Riverine (fluvial) flood & dam breach
River overtopping and dam breach inundation mapped with HAND (Height Above Nearest Drainage) on fine terrain, where a few metres of elevation decide whether a building floods. We deliver flood depth and extent for every building, under both current and future climate scenarios — not one flag for the whole district.
Inundation depth (m) 0 to 5
FEMA · public domain
Acute · hydrological
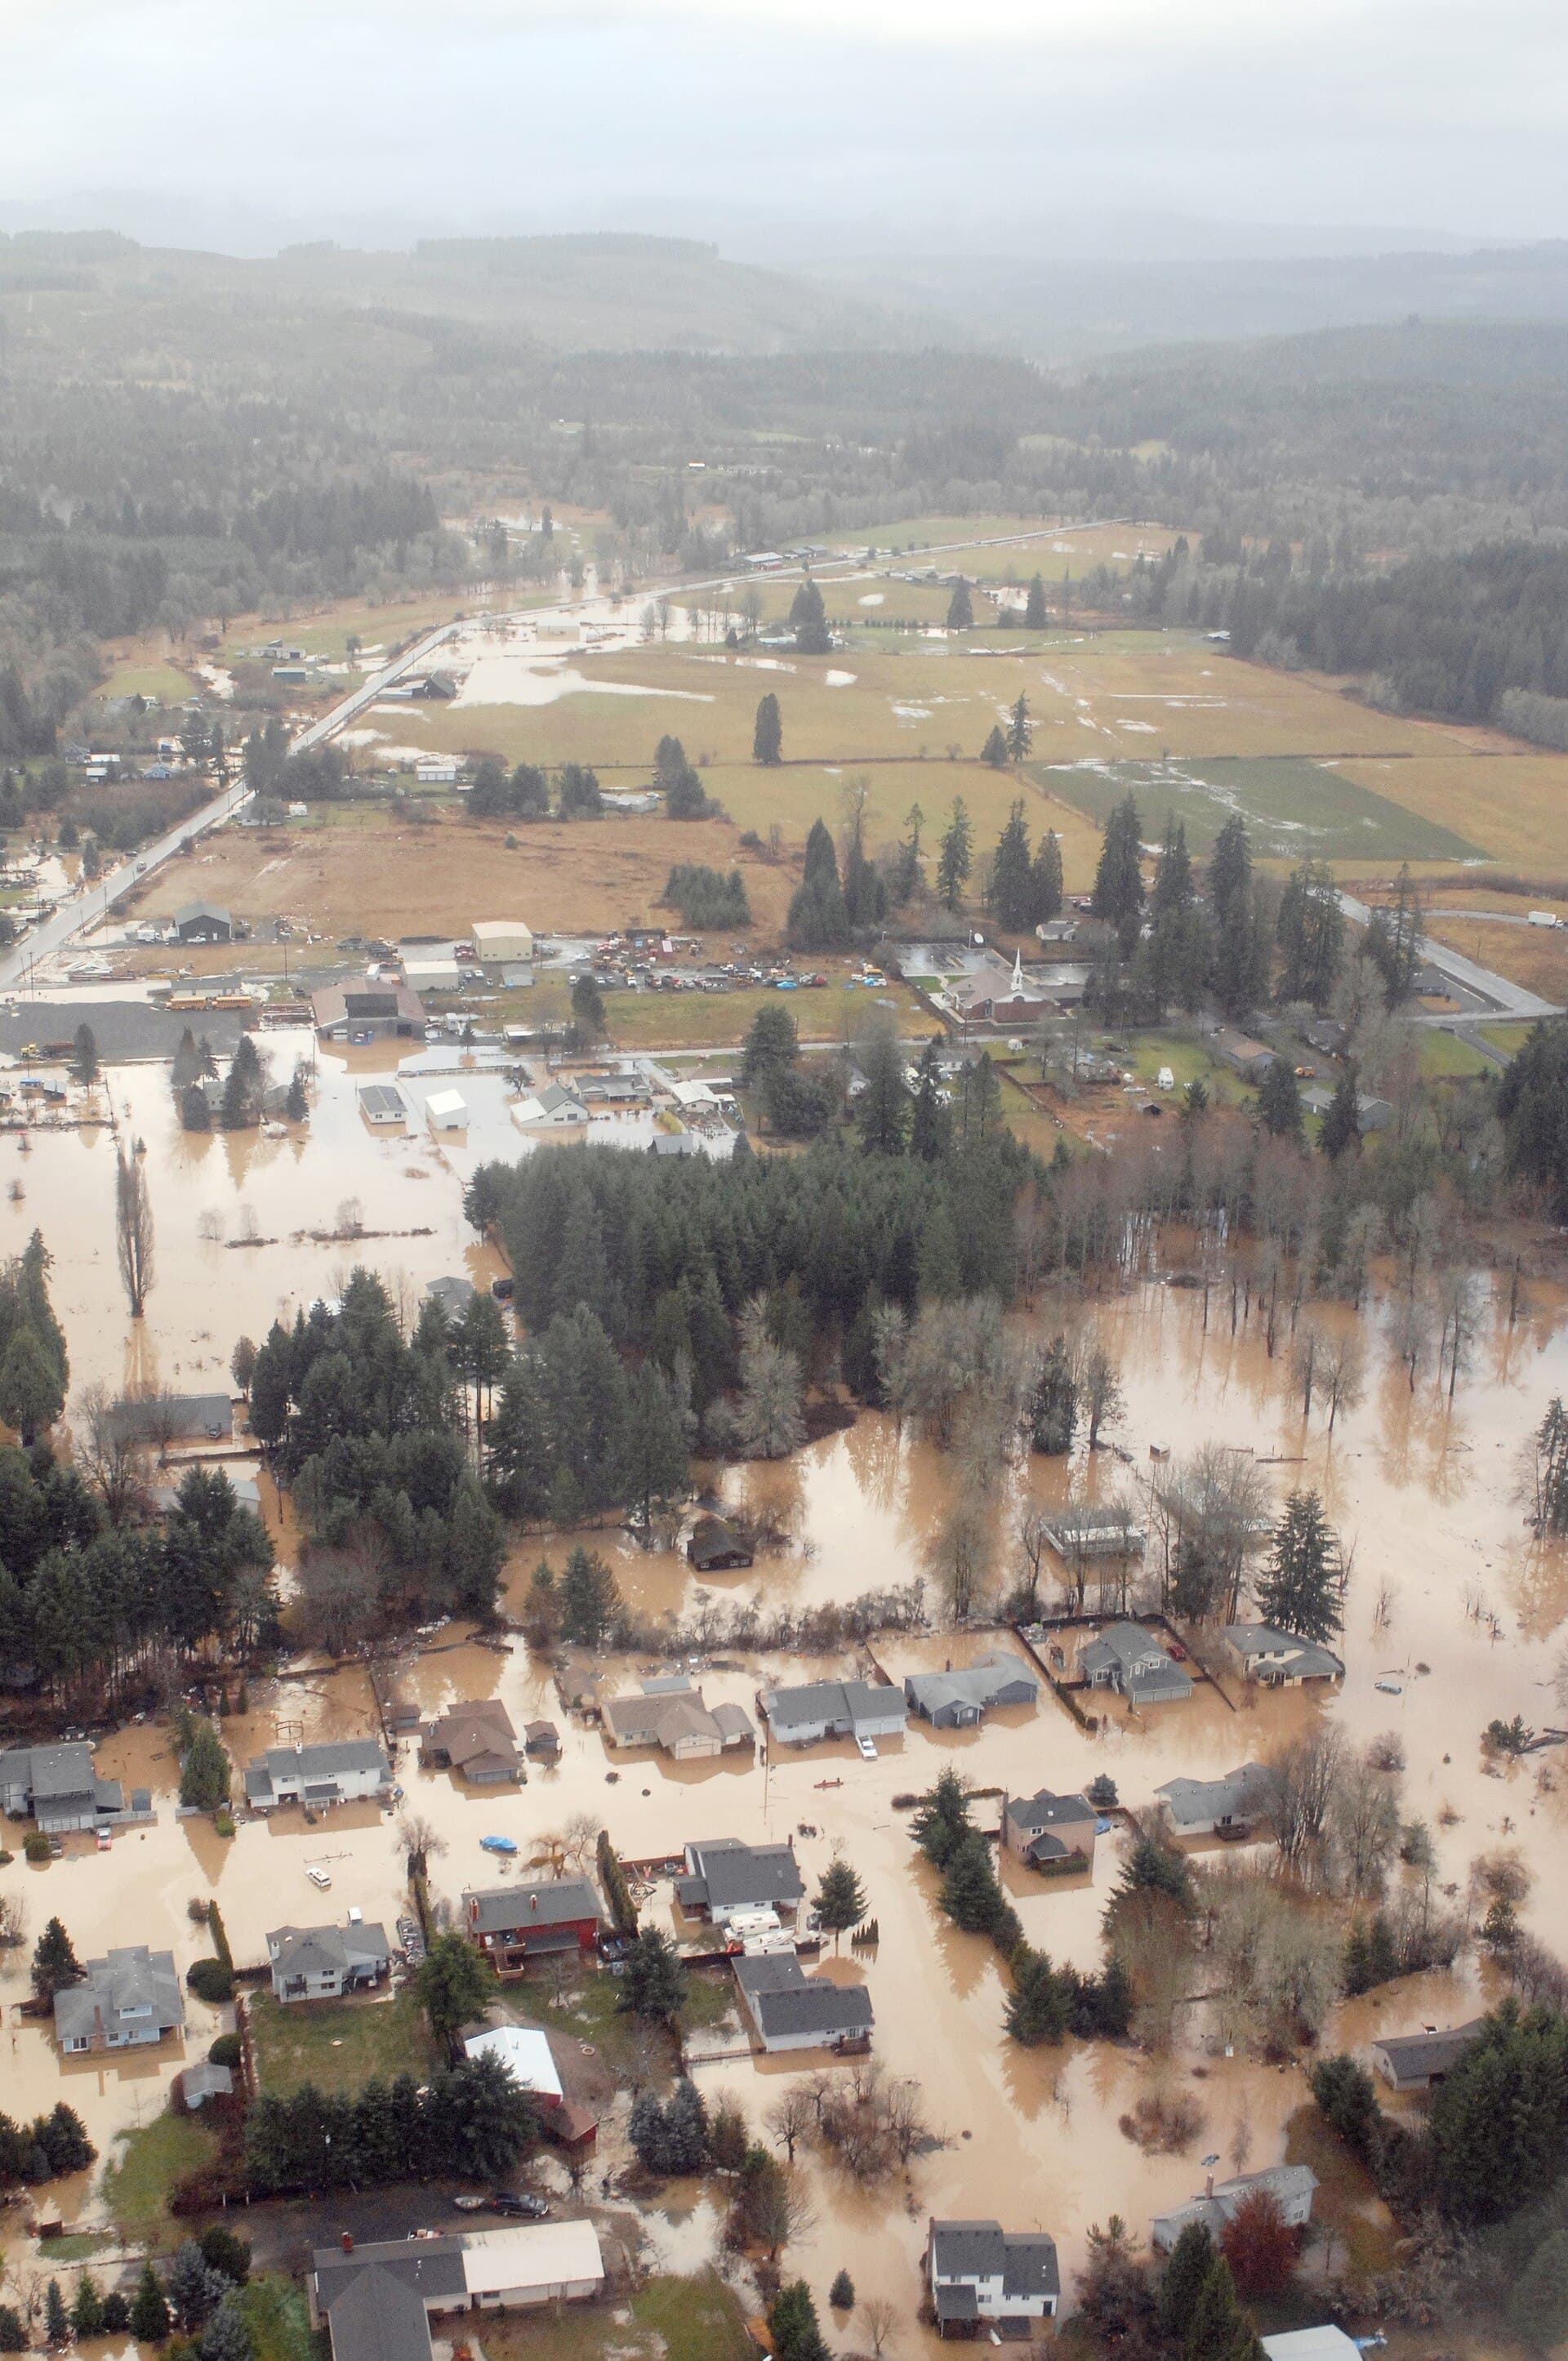
Surface water (pluvial) flood
Extreme rainfall runoff is simulated over terrain and land cover to capture urban pluvial flooding. Advanced hydraulic modelling and machine learning techniques resolve flow pathways, flood depths, and flow velocities to generate street scale inundation maps, identify drainage bottlenecks, and pinpoint flood hotspots for infrastructure planning and climate resilience. The output provides flood depth and inundation extent.
Inundation depth (m) 0 to 5
USAF · public domain
Acute · coastal
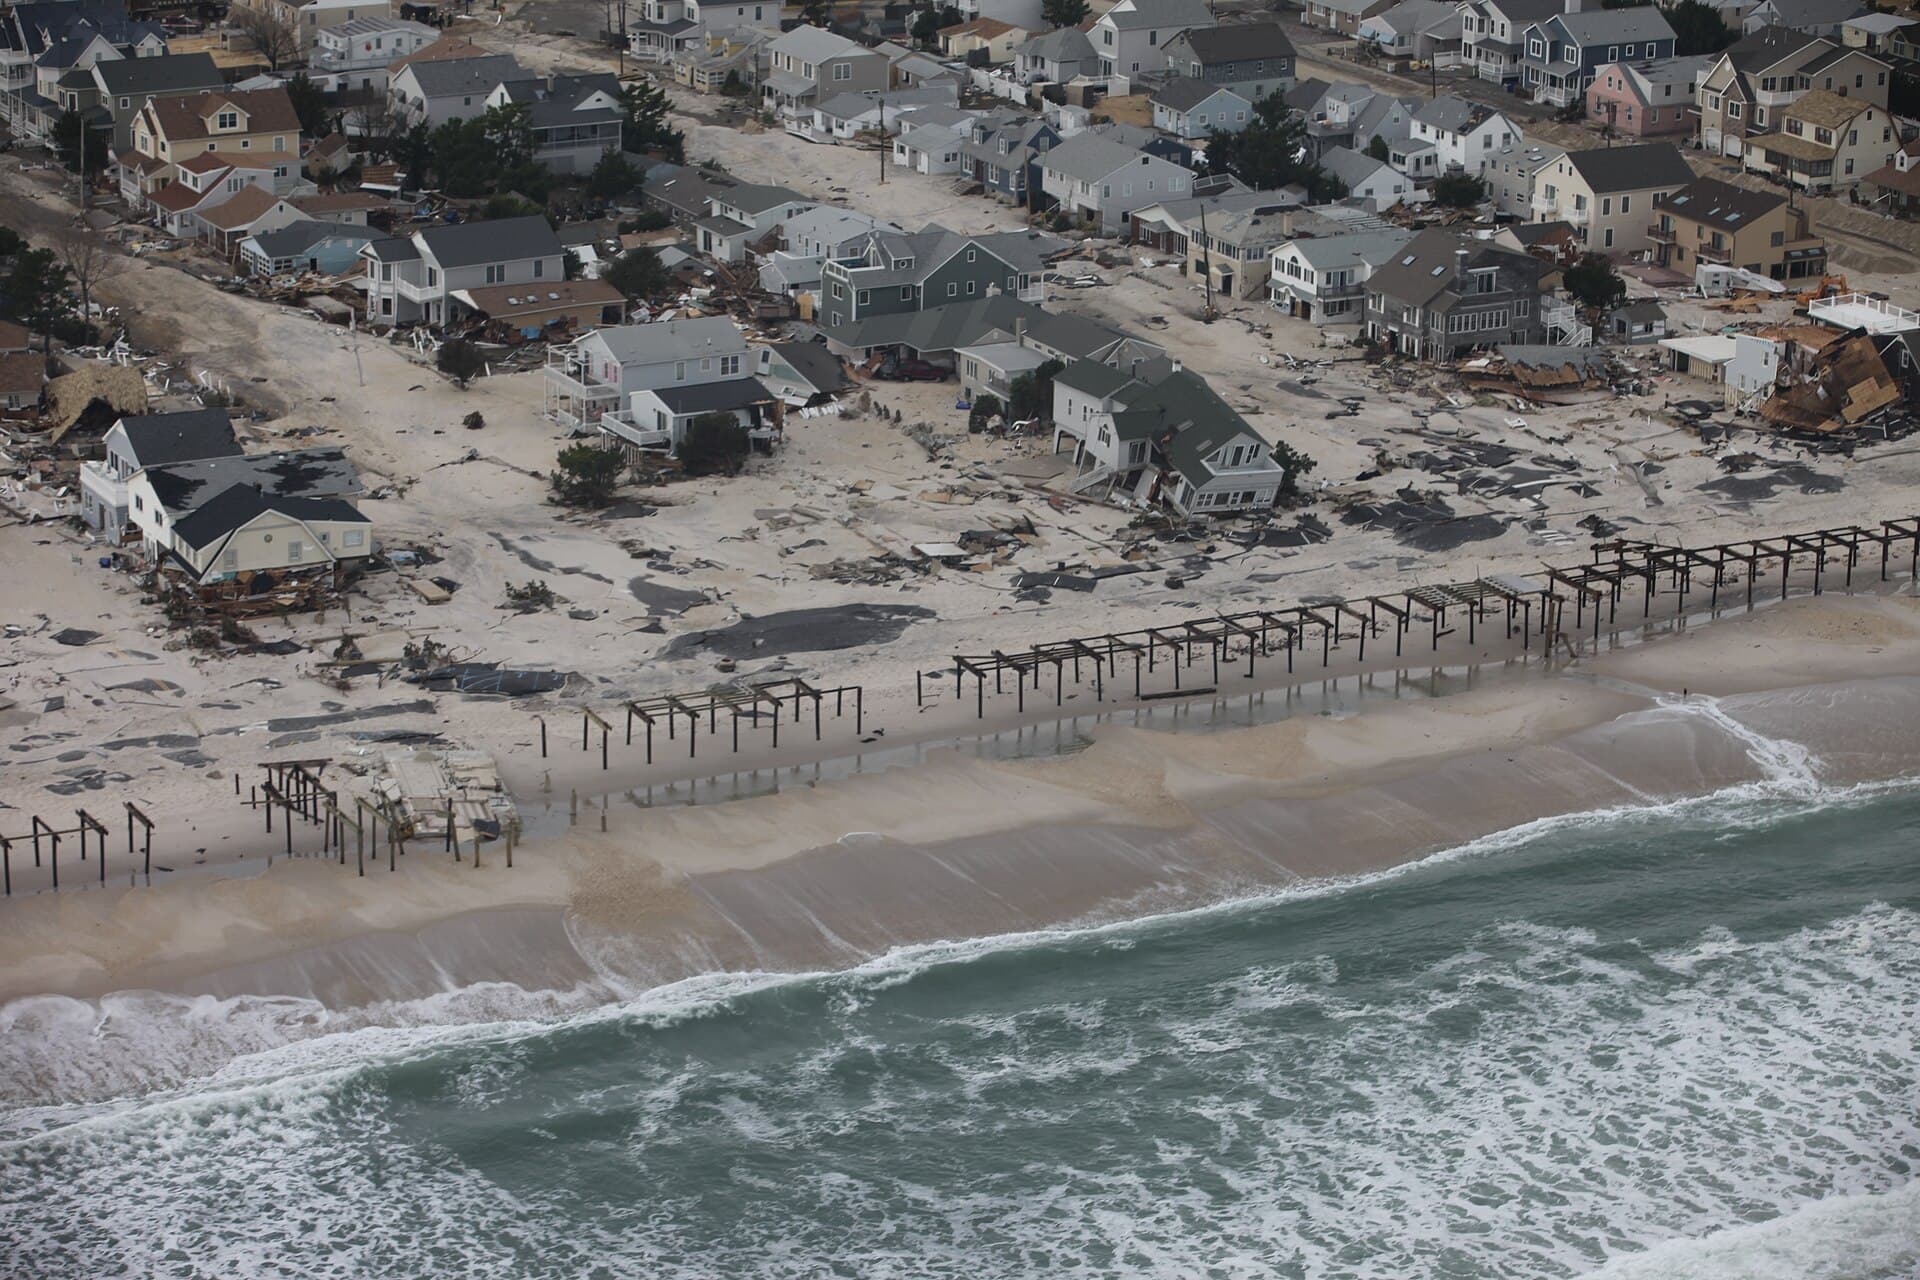
Coastal storm surge inundation
Global simulation of coastal flooding using coastal terrain data, tidal conditions, storm surge, wave setup, and projected sea level rise. Advanced hydrodynamic modelling quantifies flood depth, inundation extent, and water levels for current and future climate scenarios, enabling asset level coastal risk assessment.
Storm surge inundation (m) 0 to 5
USFWS · public domain
Chronic · thermal
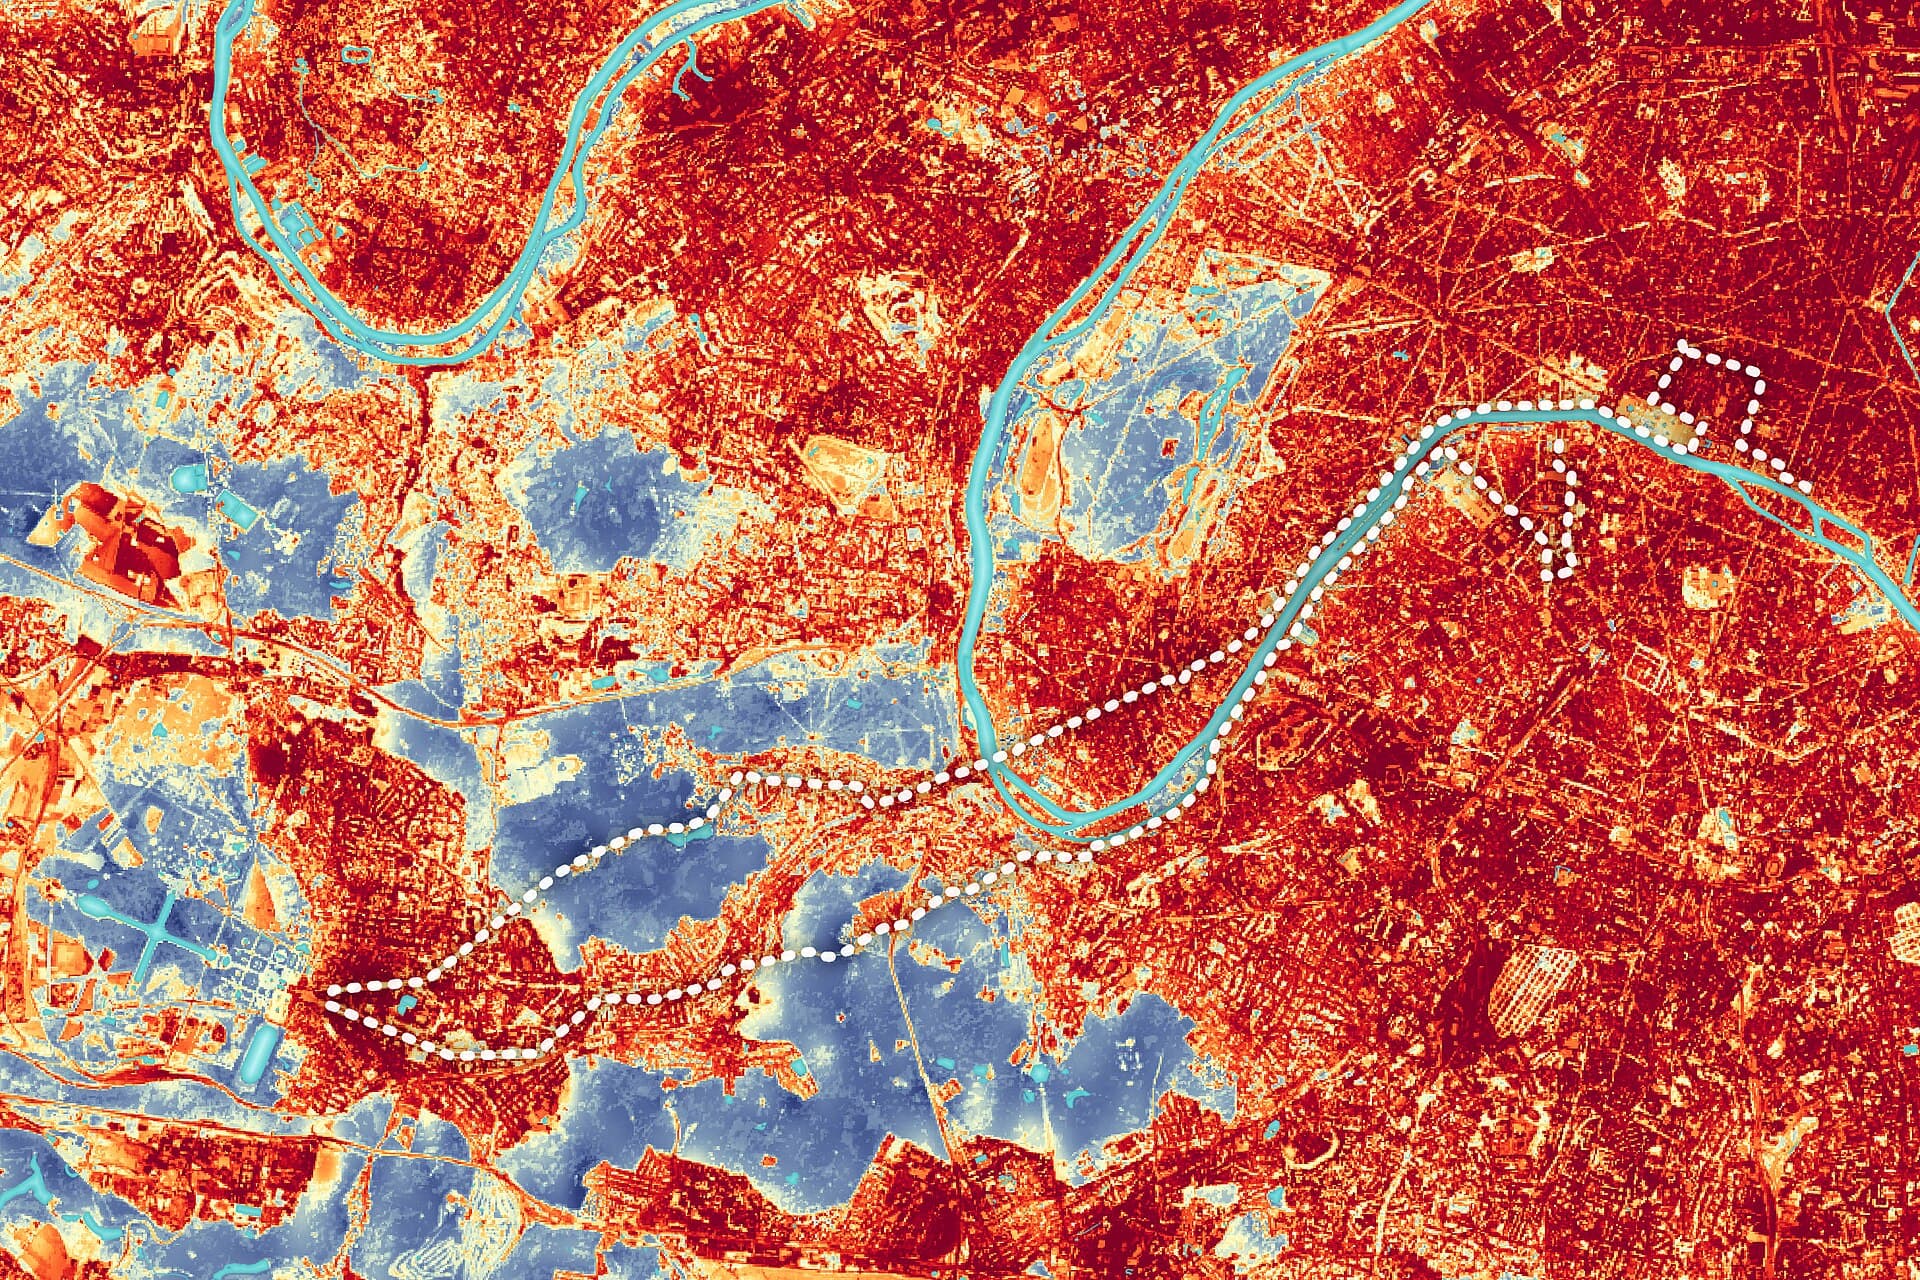
Extreme heat
Extreme heat measures the combined impact of air temperature and humidity to quantify heat stress under current and future climate scenarios. The platform identifies areas exposed to increasing heat risk, supporting climate adaptation, workforce planning, and infrastructure resilience.
Heat stress (°C) 27 to >50
NASA Earth Observatory · public domain
Acute · pyrogeographic
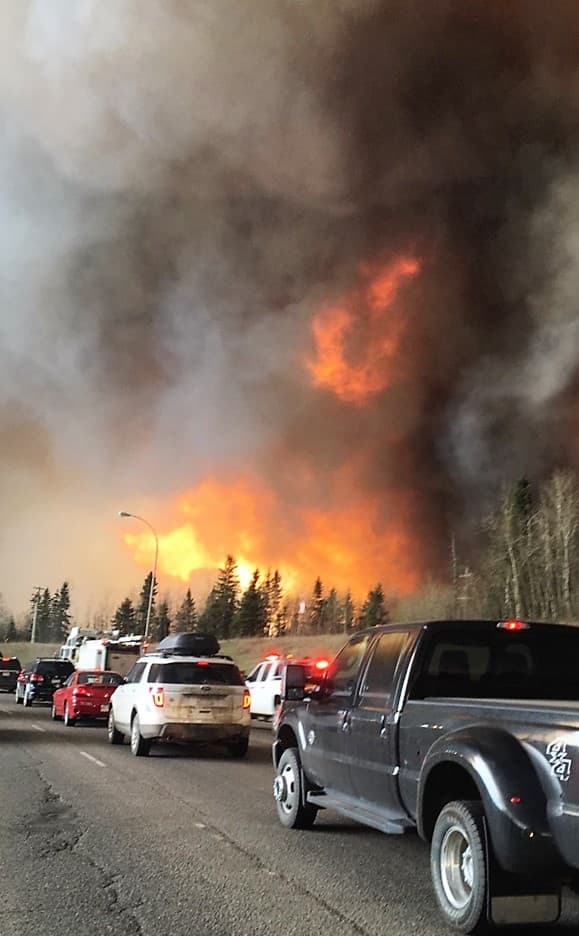
Wildfire
Wildfire probability is modelled using a machine learning based presence only prediction approach trained on vegetation, terrain, fire weather, bioclimatic variables, and human activity to identify areas susceptible to fire ignition and spread. The platform generates asset level burn probability and exposure maps for current and future climate scenarios.
Wildfire probability (%) 0 to 100
DarrenRD · CC BY-SA 4.0
Acute · meteorological
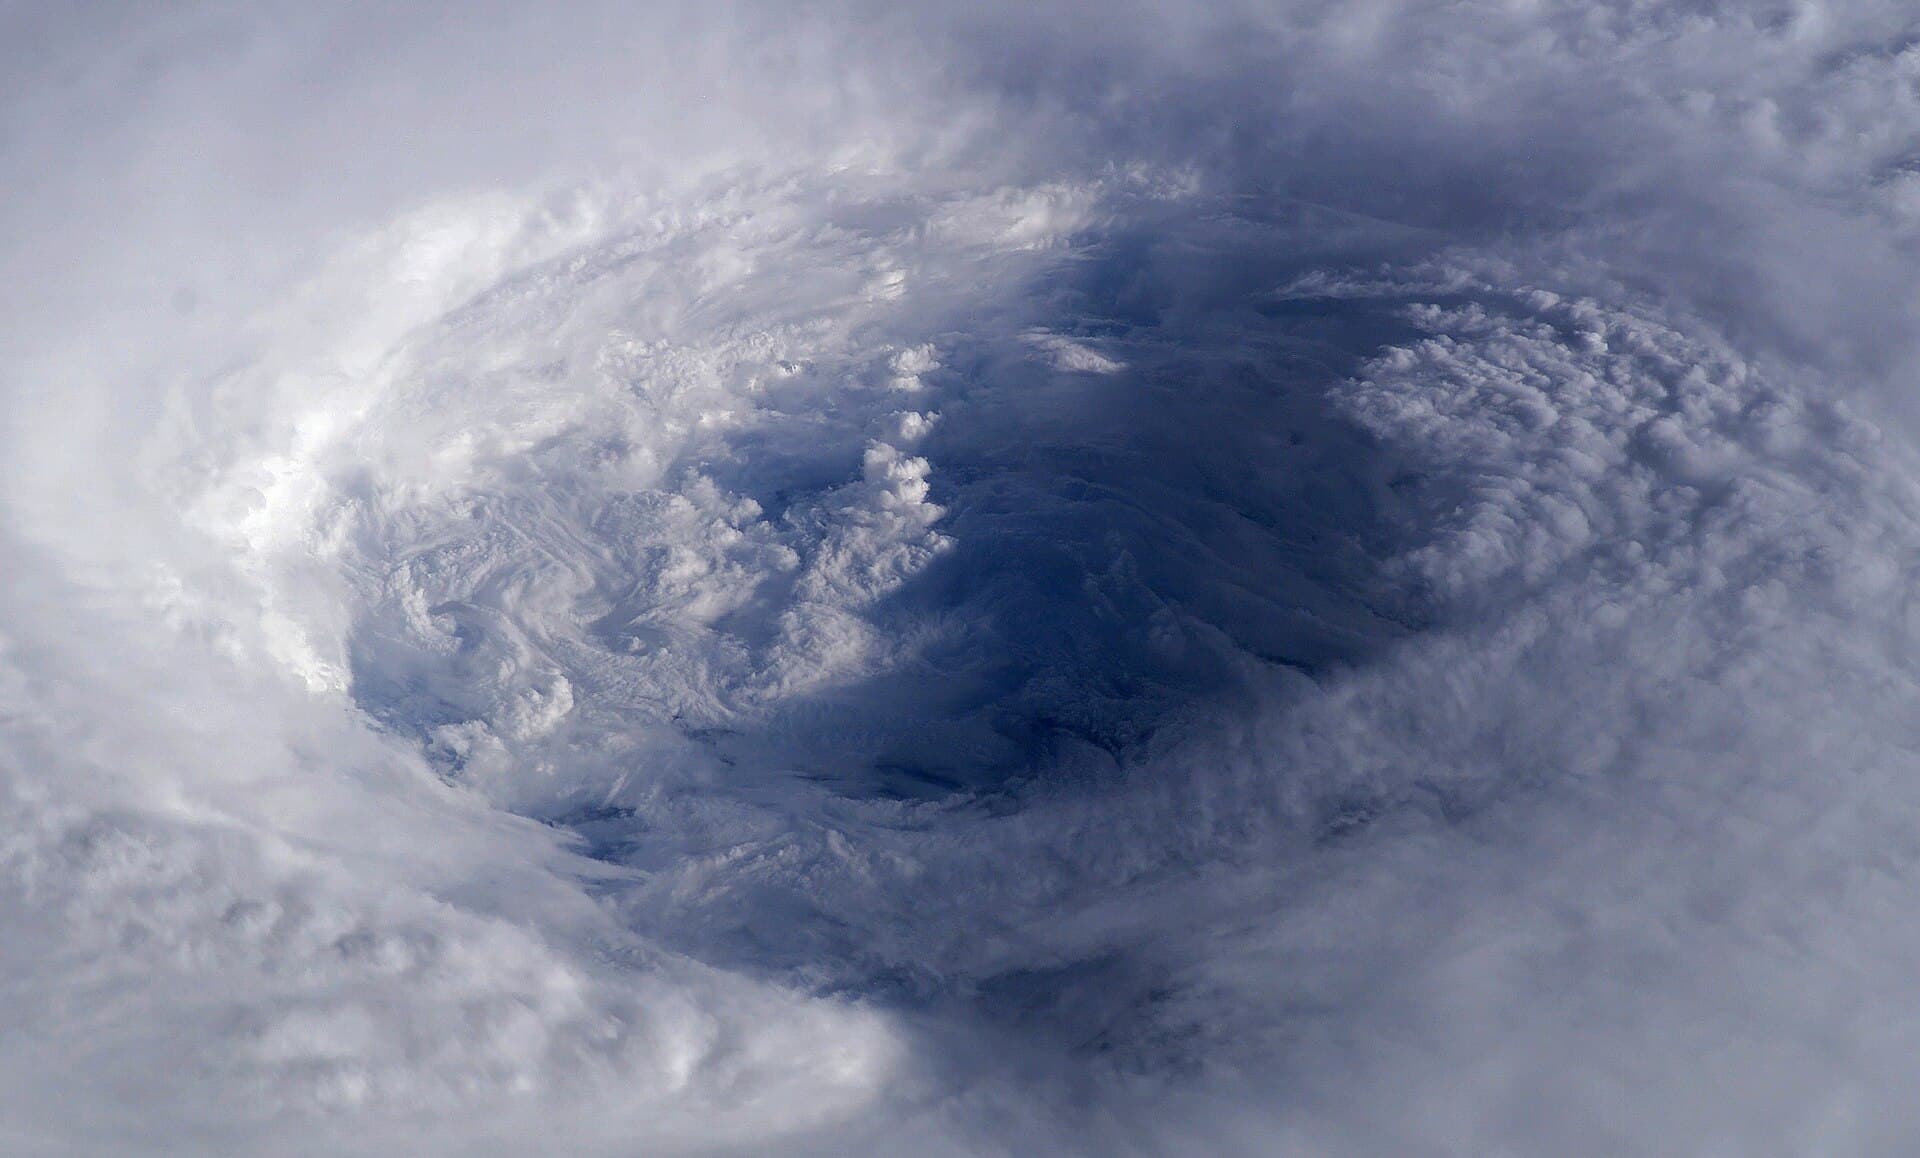
Tropical cyclone & wind
Historical tropical cyclone records, terrain, land cover, and climate datasets are integrated to quantify cyclone and extreme wind hazards across hurricane, typhoon, and cyclone basins. The platform generates asset level wind intensity, return period, and exposure maps for current and future climate scenarios.
Typhoon (km/h)
NASA · public domain
Chronic · hydroclimatic
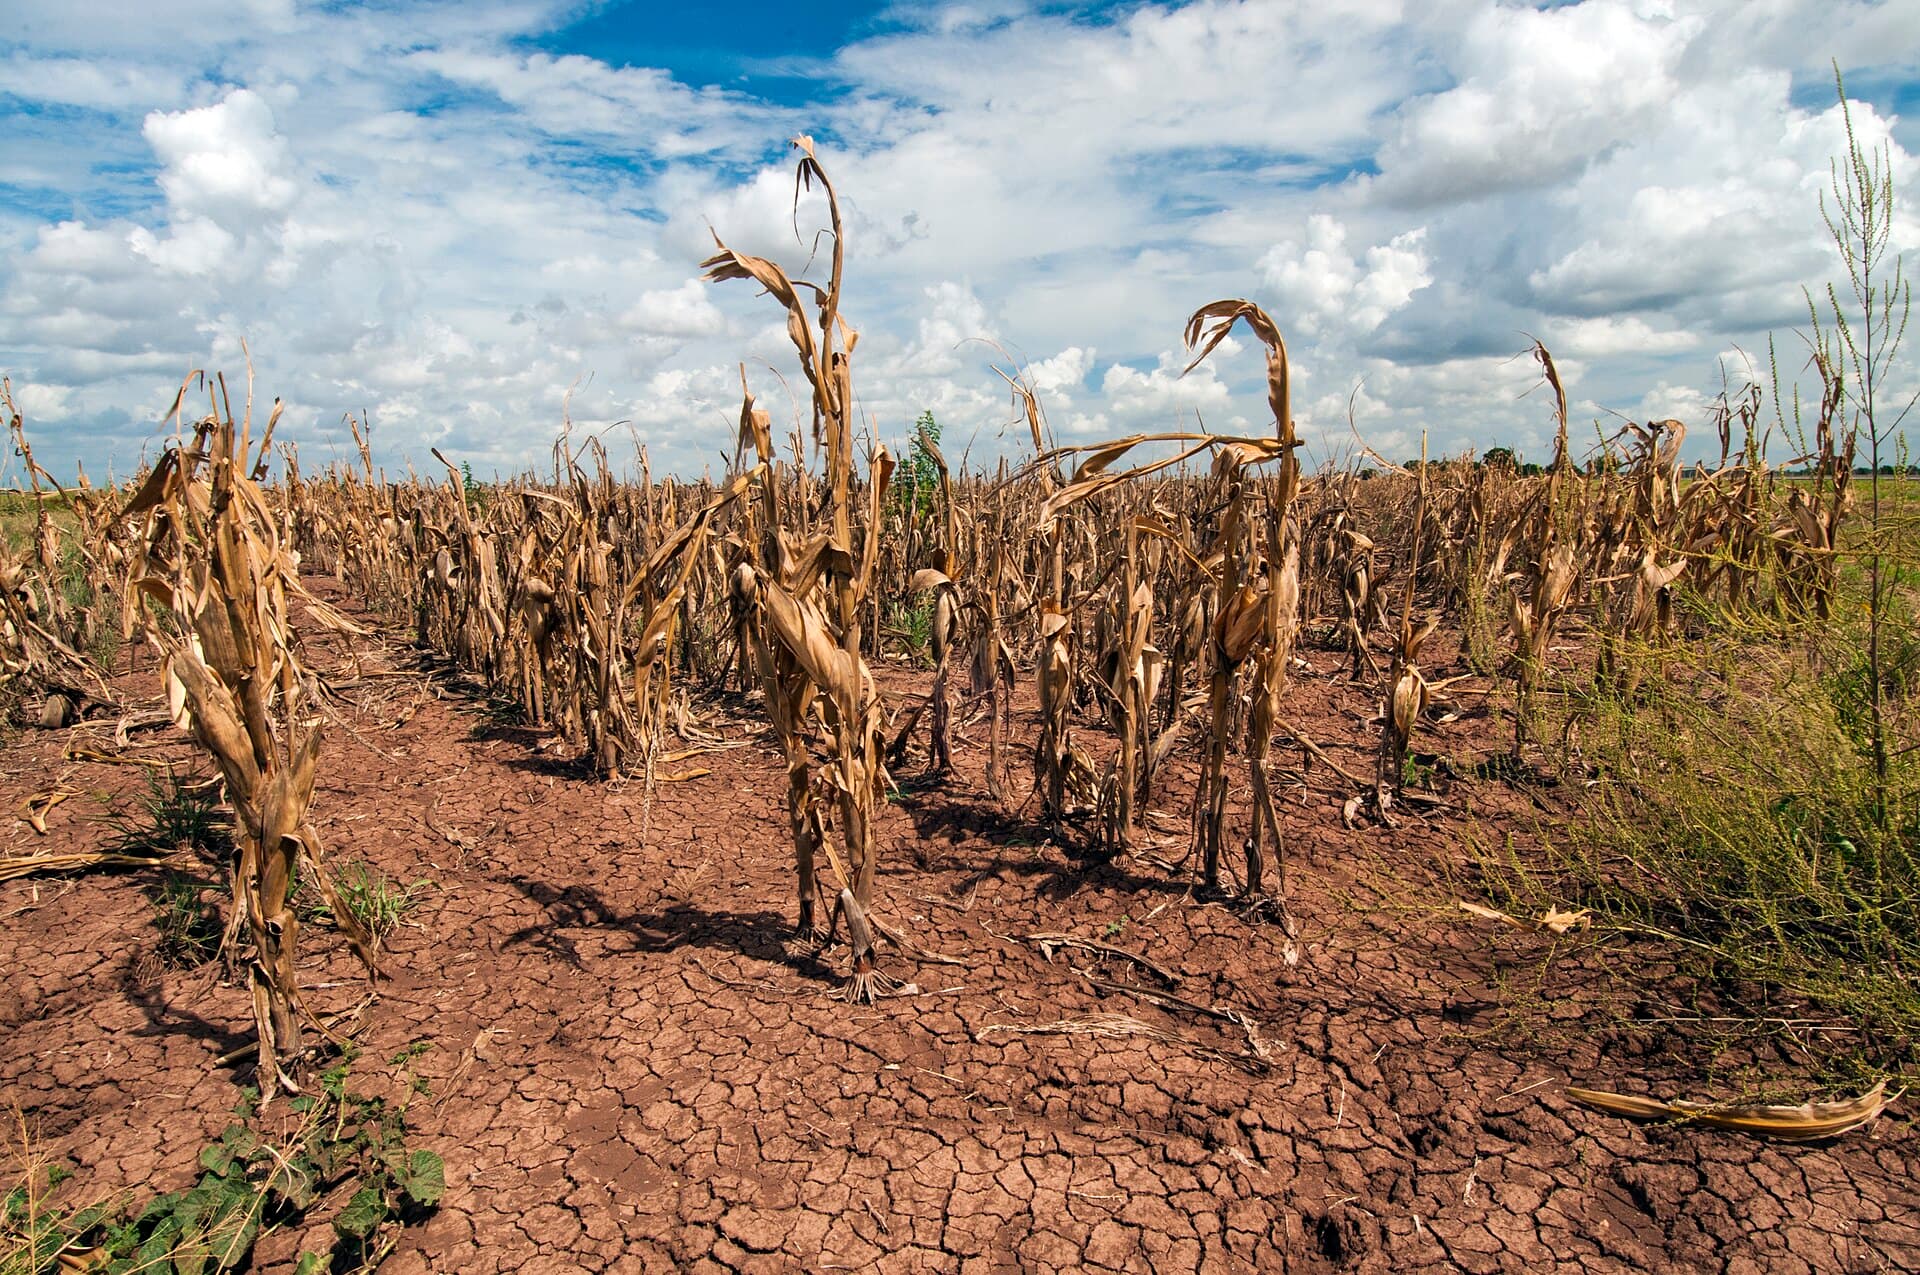
Drought
Drought hazard is quantified using precipitation, evapotranspiration, soil moisture, vegetation, and climate projections to assess drought severity, duration, and extent. The platform generates asset level drought maps for current and future climate scenarios.
Drought severity (SPEI)
USDA · public domain
Climate stress indices
30+ standardised metrics, each auditable.
Beyond the headline perils, PeriLens computes the standard WMO climate index set used across IPCC assessments, produced from baseline and projected forward on the same grid, each shipped with definition, units, baseline period and uncertainty band.
Climate heat stress indices
- Days above 35 °C
- Days above 40 °C
- Annual number of days in hot period
- Annual warm spell duration index days
Climate cold stress indices
- Annual minimum temperature
- Annual cold spell duration index days
- Annual mean daily minimum temperature
- Frost days
- Ice days
Climate precipitation stress indices
- Maximum daily precipitation
- Annual precipitation sum
- Maximum precipitation over 1 day & 5 days
- Very heavy precipitation days
- Extreme precipitation days
- Precipitation on very wet days
- Precipitation on extreme wet days
Climate drought stress indices
- Drought duration per year (rainfall < 1 mm/day)
- Drought severity per event (SPI = −1)
- Maximum dry spell duration (rainfall < 1 mm)
- Annual SPEI sum
- Meteorological dry days
- 10 day dry spell duration
Feature intelligence
From coarse pixels to crisp features.
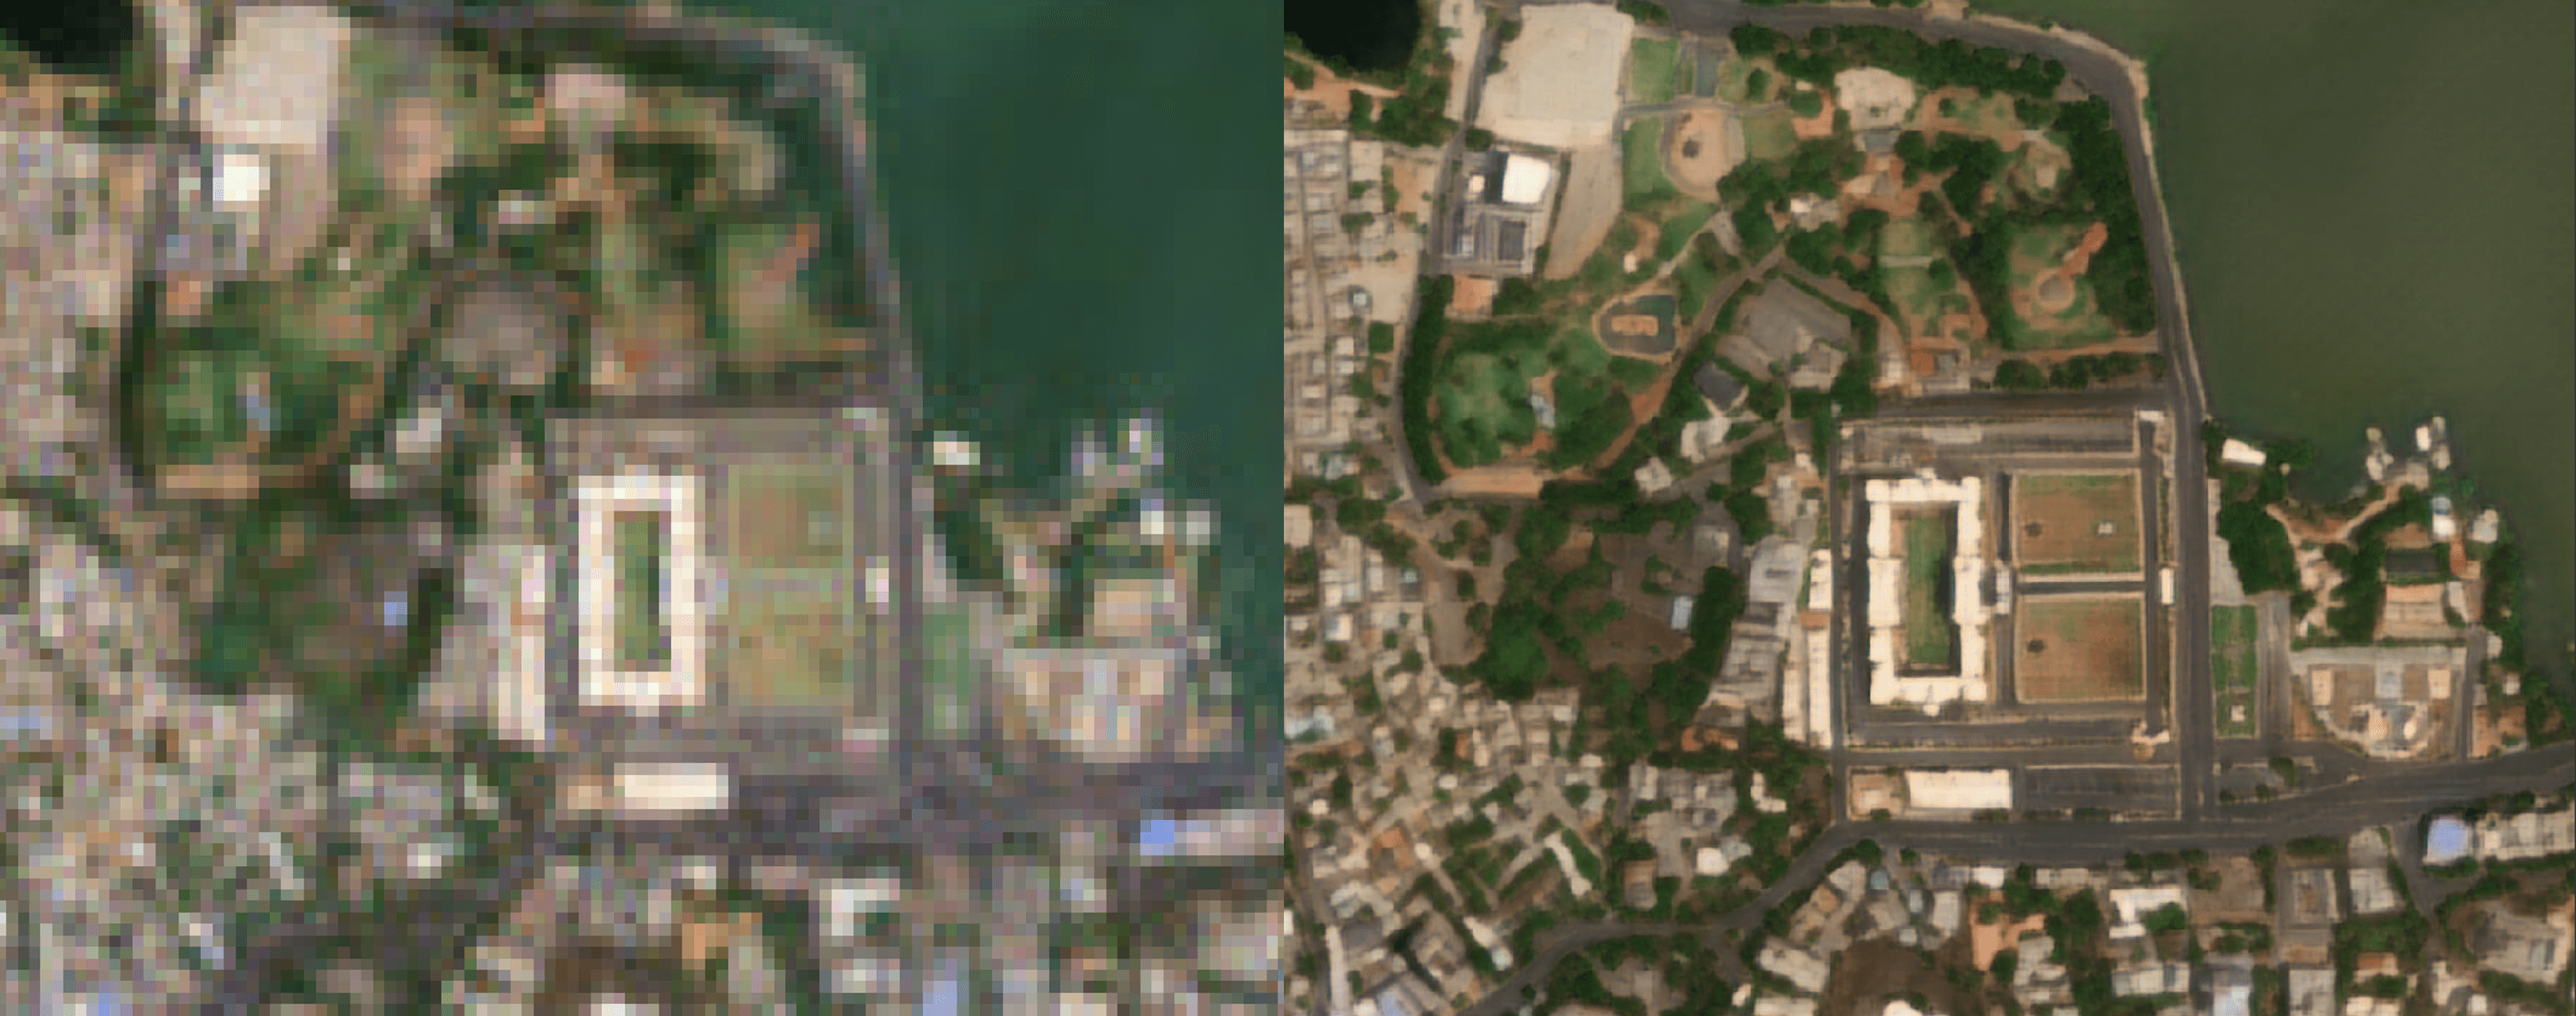
Deep learning models enhance the spatial resolution of satellite imagery for the selected study area. AI powered segmentation automatically identifies and extracts asset footprints, including buildings, transportation networks, crop parcels and water bodies, creating high granularity datasets for climate hazard modelling, asset level risk assessment, and informed decision making.
Super resolution → segmentation → footprints for each asset
The map module
Download your area of interest, at the scale you decide.
Serve any region as 10 / 5 / 1 km tiles for screening, or export a custom GeoTIFF / COG bounding box for the exact assets that matter, delivered through an interactive web map, scheduled reports, or a REST and tile API (XYZ, WMS, WMTS, COG).
Screen
Coarse tiles for fast portfolio screening across whole countries, covering thousands of assets at once.
Prioritise
District and portfolio segment resolution, the level at which most asset managers run scenario analysis.
Zoom
City and corridor detail for prioritising the specific assets that warrant a full study.